You may not realize that a battery’s health hinges on repeatable, even micro-level steps we can document and compare. We’ll start with safety-first prep, then verify wiring integrity, and proceed to controlled discharge, impedance checks, and capacity tracking. Each step feeds the next, so small variances matter. If our data shows anomalies or drift, we’ll flag red flags and plan follow-up tests under stable conditions to confirm conclusions. Let’s outline the protocol and set up the measurements.
Key Takeaways
- Start with a defined test plan, including representative cell states and clear acceptance criteria to ensure repeatable results.
- Verify instrumentation: calibrated multimeters and proper chargers; log capacity, voltage, impedance, and temperature with timestamps.
- Perform a dry-wire/low-current verification before full tests to confirm wiring integrity and measurement stability.
- Conduct capacity tests (e.g., C/1 or C/2) to compare actual capacity against rated value and assess health verdict.
- Track degradation indicators (SEI growth, impedance rise, swelling, temperature) across cycles to identify red flags and degradation trends.
Prep Your Workspace and Safety Gear for Lithium Battery Testing
To begin testing lithium batteries safely and reliably, we first establish a controlled workspace and gear up with appropriate safety equipment. Our prep workflow begins with a dedicated fume-free bench, nonstatic mat, and grounded, residue-free surfaces. We select a compatible charger, a fire-safe enclosure, and a calibrated multimeter for voltage and impedance checks. Personal safety protocols require eye protection, gloves, and a lab coat; ensure no metal jewelry, and keep flammable materials away. We organize test leads, clamps, and thermal sensors in clearly labeled containers. Ventilation is verified, and a Class B fire extinguisher is within reach. We document baseline conditions before any handling. This disciplined approach minimizes risk and supports repeatable results through consistent safety protocols and meticulous preparation.
Run a Basic Capacity Test and Read the Results
How do we begin a basic capacity test and interpret the results? We set a defined current, typically C/1 or C/2, and discharge to a controlled cutoff voltage, recording capacity in mAh. We log time, voltage, and current continuously, ensuring a stable environment and consistent ambient conditions. After discharge, we compare measured capacity to the cell’s rated value, noting percent of nominal capacity and any early termination indicators. We document test duration, cutoff criteria, and any deviations from the protocol. Expect two word discussion ideas like accuracy vs. reproducibility, and interpretation versus specification. Be mindful of testing pitfalls such as voltage rebound, rate inconsistency, and temperature drift that can skew results. Conclude with a concise verdict on health status and recommended next steps.
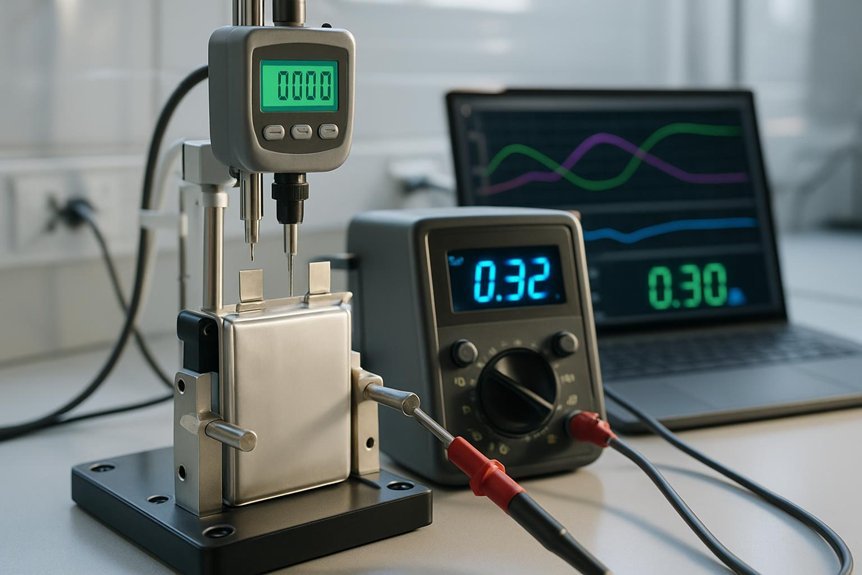
Measure Internal Resistance and Track Impedance Growth
We measure internal resistance with a controlled AC impedance approach and record trend data over time. We monitor impedance growth to identify early signs of degradation and capacity loss. By tracking these metrics, we correlate resistance changes with performance shifts and set thresholds for action.
Measure Resistance Trends
Are internal resistance and impedance growth reliable indicators of battery health, and how can we track them over time? We monitor resistance trends by performing consistent, repeatable measurements at defined states of charge and temperature. We use a fixed test current, measure voltage drop, and calculate ohmic resistance, then log results in a linear timeline. We normalize for age, chemistry, and cell balancing to isolate intrinsic changes. We plot short- and long-term trends, flagging deviations beyond predefined thresholds. We pair resistance data with capacity and power metrics to interpret performance shifts. We document measurement conditions, equipment tolerances, and calibration records to ensure traceability. This two word discussion ideas—resistance trends—focuses our attention on stable baselines, identifying gradual degradation before rapid failure.
Track Impedance Growth
Impedance growth tracking combines internal resistance measurements with frequency-domain analysis to reveal evolving cell and pack health. We proceed by establishing baseline impedance at multiple frequencies and temperatures, then repeat measurements under identical test conditions to detect drift. We record AC perturbations or impulse responses to extract impedance spectra, focusing on both real and imaginary components across the spectrum. From these data, we compute the resistance growth rate and monitor high-frequency versus low-frequency behavior, which reflect electrode kinetics and diffusion limitations. We interpret gradual increases as potential aging signals, differentiating thermal effects from chemistry-driven changes. We emphasize consistent procedure, rigorous calibration, and reproducible averaging to improve impedance tracking reliability. The goal is to assess healthy aging or degradation trajectories and inform maintenance planning.
Assess Cycle Life: How Stability Changes Across Cycles
We assess cycle life by examining stability changes across successive charge-discharge cycles, focusing on how capacity retention and impedance evolve. We identify cycle stability trends to quantify degradation rate under defined test conditions and load profiles. We also consider capacity decline factors, isolating effects from SEI growth, phase transitions, and mechanical aging to inform reliability forecasts.
Cycle Stability Trends
Cycle stability trends describe how a lithium battery’s performance evolves over repeated charge–discharge cycles. We observe voltage, capacity, and internal resistance responses at controlled C-rates and temperatures, recording pristine cycles and degraded ones to build a coherent profile. Our approach emphasizes repeatability, documenting cycle counts, state-of-charge windows, and thermal conditions to minimize confounding factors. We plot capacity retention versus cycle number, resistance rise, and energy efficiency, then interpret these curves to gauge stability. For trend interpretation, small, consistent changes signal stable chemistry, while abrupt or nonlinear shifts indicate emerging degradation mechanisms. We compare initial and mid-life segments to establish a baseline, then quantify rate constants and time constants where applicable. The result informs remaining useful life estimates and suitability for intended duty cycles.
Capacity Decline Factors
What factors drive capacity decline across cycles, and how do they interact to limit cycle life? We examine capacity decline factors by isolating mechanisms and correlating them with observable performance. Capacity degradation arises from active material loss, electrode impedance growth, and electrolyte aging, each accelerating with state of charge, temperature, and cycling rate. SEI growth consumes lithium and increases resistance, while active material cracking disrupts percolation paths and lowers usable capacity. Hysteresis and parasitic reactions reduce coulombic efficiency, compounding with aging indicators such as impedance rise and capacity fade. We quantify by full-charge, full-discharge tests and rate-capacity windows, tracking aging indicators over cycles. Understanding these interactions enables targeted aging mitigation, enabling more accurate cycle-life forecasts and informed health assessments.
Diagnose Degradation: Signs, Thresholds, and Red Flags
Diagnosing degradation starts with recognizing clear signs and establishing thresholds that separate normal aging from meaningful performance loss. We systematically compare current performance to baseline measurements, noting deviations that exceed established degradation markers. We quantify capacity fade, impedance growth, and power delivery reduction, and we track rate of change over fixed test intervals. We identify safety thresholds that trigger further inspection or maintenance, such as excessive heat, swelling, unusual voltage behavior, or rapid self-discharge. We differentiate transient fluctuations from persistent trends by repeating tests under controlled conditions and across multiple cycles. We document correlations between performance anomalies and operating conditions, enabling targeted diagnostics. Finally, we flag red flags—unexpected energy drop, cyclic stress anomalies, or irregular charge curves—that warrant deeper investigation.
Reconditioning, Recycling, or Replacing a Pack: Decision Factors
When a pack shows signs of degradation, we must weigh options beyond simply continuing use. We present a decision framework that prioritizes safety, reliability, and cost. First, assess remaining capacity, internal resistance trends, and calendar age to quantify loss of performance. If degradation is moderate and cells remain balanced, reconditioning can restore usable capacity, provided we follow controlled procedures and document outcomes; consider reconditioning ethics to ensure transparency and accountability. If performance cannot meet functional requirements, recycling viability becomes central, emphasizing safe material recovery and environmental impact. When refurbishing isn’t feasible, replacing the pack may be warranted, balancing downtime, warranty considerations, and total cost of ownership. Communicate clearly, record decisions, and align choices with regulatory and safety standards.
Tools and Tips for Different Battery Chemistries and Uses
Are you choosing the right tools and methods for different battery chemistries and uses, or do you want a clear, repeatable workflow? We present a concise toolkit tailored to each chemistry and application. Begin with precise instrumentation: calibrated multimeters, constant-current/constant-voltage chargers, and data-logging testers to capture capacity, internal resistance, and cycle stability. For safety protocols, isolate tests, use appropriate PPE, and verify venting and thermal limits specific to each chemistry. We distinguish Li-ion, LiFePO4, and nickel-based variants by voltage windows, charging profiles, and degradation indicators. Apply conservative load profiles for high-drain packs and gentle ramps for low-drain cells. Maintain traceable procedures, record environmental conditions, and validate results with repeat tests. This approach ensures reliable comparisons while minimizing risk to personnel and equipment.
Quick-Start Checklist for Home Li‑Ion Testing
A quick-start checklist helps us establish a safe, repeatable baseline for home Li‑ion testing. We begin with a defined test plan, selecting a representative cell state and outlining acceptance criteria to avoid scope creep. Next, confirm environment controls: stable ambient temperature, adequate ventilation, and nonconductive workspace. We then verify safety protocol with eye protection, gloves, and a fire-ready secondary containment; document any hazards before power connects. Assemble measurement gear: a calibrated multimeter, a suitable current source, and a data logger configured for timestamped readings. Calibrate instruments per manufacturer guidance and record calibration data. Before execution, inspect connectors and insulation for damage, and establish emergency shutdown procedures. Finally, run a dry, low-current verification to validate wiring integrity and measurement stability before full tests.
Frequently Asked Questions
How to Interpret Test Results Across Different Cell Chemistries?
We interpret results by acknowledging interpretation nuances across chemistry variability, then compare baseline metrics within each cell type, calibrate against known ranges, and apply cross-chemistry normalization to avoid false conclusions about capacity or impedance shifts.
What Are Safe Disposal Guidelines After Testing Damaged Cells?
We assure safe disposal by isolating, labeling, and coordinating with licensed e-waste haulers for damaged cells. We avoid DIY disposal, test residue risks, and follow local regulations to minimize hazards and environmental impact.
Can Non-Lab Equipment Reliably Predict Long-Term Health Trends?
We can’t rely on non-lab equipment for long-term reliability assessment; they offer preliminary indicators, but non-lab measurements must be corroborated with lab-grade tests to predict health trends with acceptable confidence.
How Do Ambient Temperature and Humidity Affect Measurements?
Ambient temperature and humidity significantly affect measurements; we observe ambient effects on voltage, impedance, and capacity, with humidity influence increasing leakage currents. We control environment, record conditions, and adjust results to reflect stable baselines for accurate interpretation.
What Are Cost-Effective Alternatives for Professional Testing?
Cost effective testing options include affordable multimeters, impedance testers, and smartphone diagnostics, plus at-home data logging with discharged-resistance holds. We, readers, perform stepwise checks, document results, and compare to manufacturer specs for reliable at home diagnostics.
Conclusion
We’ve rowed this ship through steady currents of measurement and method, steering by the compass of data. Like a lighthouse keeper reading a fading beacon, we watch impedance drift and capacity wane, translating signals into disciplined action. When results align with baselines, the voyage proceeds; when they don’t, we anchor, recheck, or part ways. In every test, we preserve safety, repeatability, and clarity, ensuring the battery’s health chart stays honest and actionable.

